At Encora, our expertise covers the most important Business Intelligence and Analytics platforms like Tableau, Power BI and Qlik, so we can help you make the optimal decision to invest in a self-service analytics solution that best suits your organisation.
Let’s have a look at a side-by-side comparison of Microsoft Power BI and Tableau to meet the self-service analytics needs of medium to large-scale organisations that seek to make data-driven decisions.

When life gives you lemons data, make…
#DataDrivenCulture
Get a taste of Business Intelligence
The Financial Services industry leads early big data analytics adoption, with 76% of companies reporting current usage. According to the latest research, the most common initiatives strategic to business intelligence are Reporting, Dashboards, Advanced Visualization and End-user Self Service.
Why the need for Self-Service Analytics?
Organizations generate and collect data each minute. The goal of enabling self-service analytics is to help executives and employees alike to make better decisions, take smarter actions and operate more efficiently.
With visualization techniques, people across all levels in your organization can dive deeper into data and use the insights for faster, more effective decisions.
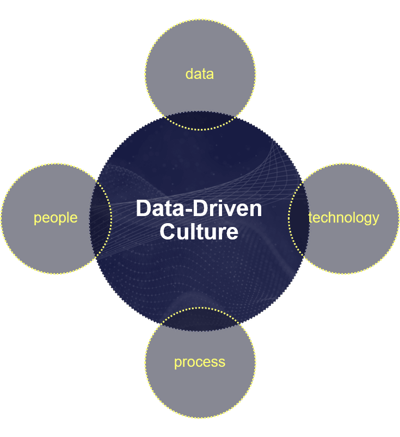
We recognize that, to have an organisation driven by data, we must first help to instil a data culture within their organization. We do this through our Data & Analytics model.
This is founded upon the four key areas that combine to create a data culture of self-service: People, Data, Technology and Process. Our experience helps us understand the importance of each and how to address them individually and collectively to ensure the successful delivery of your data strategy.
Power BI vs. Tableau

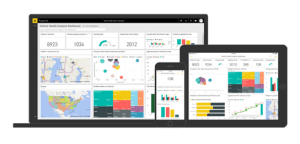
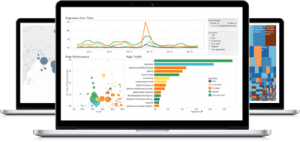
| Power BI is recognized by Gartner and Forrester as a Leader in Analytics and Business Intelligence Platforms, and Enterprise BI Platforms. | Tableau’s capabilities offer visual data journeys for the individual analyst user as well as for teams and organizations at scale and embedded analytics. |
A cost-efficient alternative to Tableau
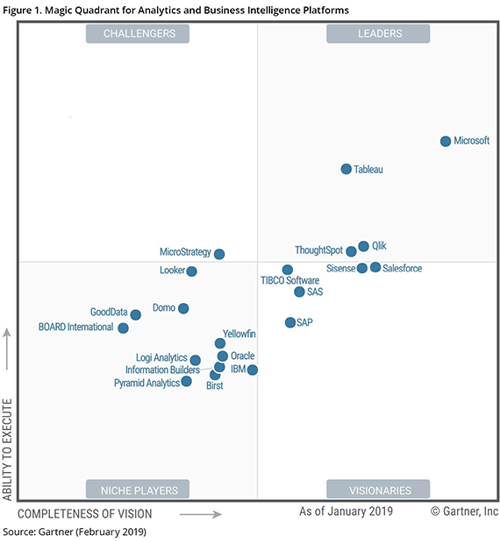
Vision: ”Microsoft is furthest to the right on the Completeness of Vision axis and has also continued to execute on its roadmap with frequent (monthly) product releases. Microsoft was relatively early to introduce search-based queries with Power BI Q&A, and has recently introduced Quick Insights as a basic form of smart data discovery. Microsoft continues to integrate its machine-learning capabilities as part of a complete solution, the Cortana Intelligence Suite. This vendor has also moved a step closer to linking insights to actions, with the recent integration of PowerBI with Microsoft Flow and within its business application, Microsoft Dynamics” (Gartner.com)
Through Power BI, the data visualization platform, Microsoft has been an analytics and BI leader for the past 12 consecutive years, as illustrated in the most recent Gartner Magic Quadrant.

Power BI is ideally suited for the need to democratize the analytics function, while Tableau is built for data analytics and specialized users rather than the general audience. Additionally, the natural integration of Power BI with the rest of the Microsoft ecosystem with other compatible and notable residents like Azure, SQL, Office 365 and Excel, is a key benefit in favour of the Microsoft solution.
To help you make a choice, we invite you to reflect on these items:
What’s your company revenue?If your organisation’s revenue exceled $20 mln. then you can consider Tableau. For less, Power BI could better serve your needs. |
What’s your budget for implementation?If it’s less than $50K, then it might make more sense probably to opt for Power BI. |
Who are the end-users?If they’re Analysts, then Tableau is a nice fit. For the general audience with casual reporting needs, we recommend Power BI. However, ad-hoc explorations do work better in Tableau.
|
What system integrations will be required?Going beyond the Microsoft environment? Points for Tableau. Datasets over 10GB? The larger the dataset, the more points for Tableau again.
|
A framework for assessing Data Maturity
Regardless of the chosen technology stack, it is important to plan and include a clear roadmap for data and analytics in your organization’s cross-functional business strategy.
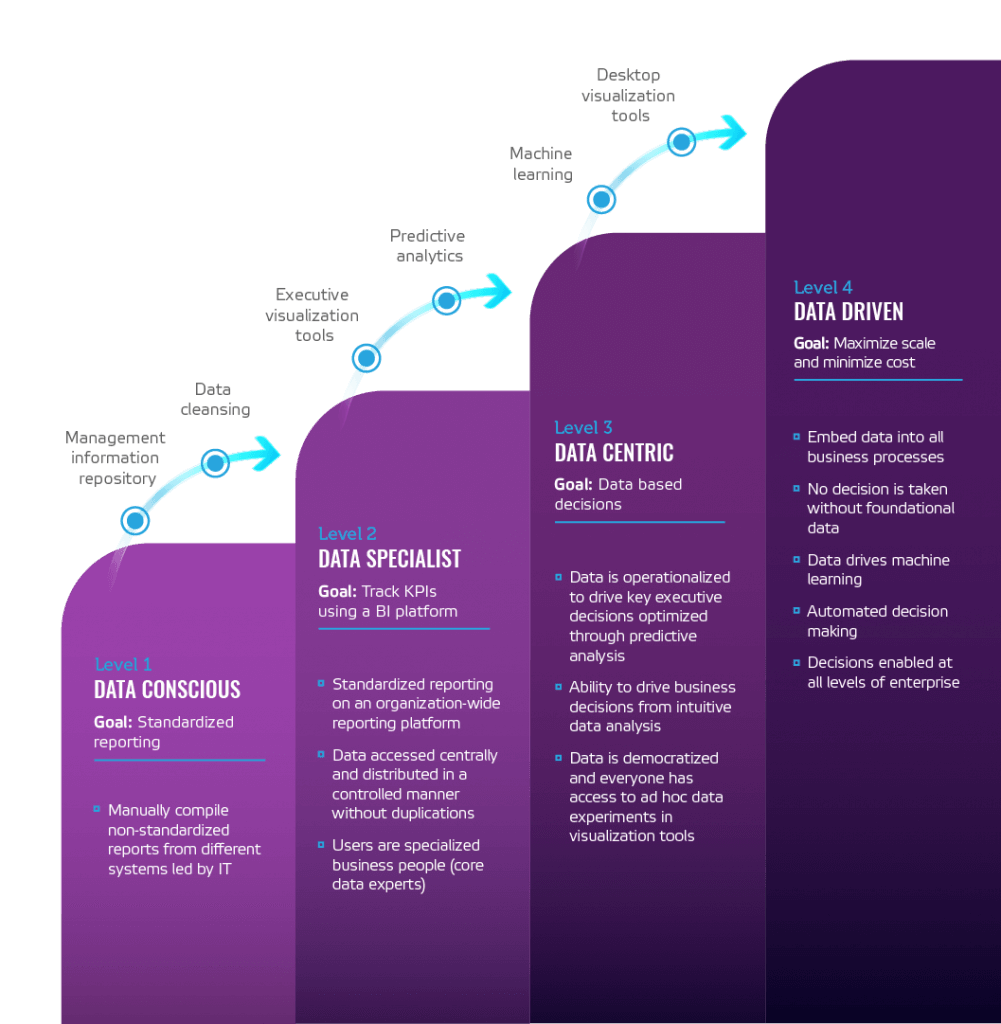
Please find the framework for assessing Data Maturity transcript below:
Where are you on the path to data maturity?
| Level 4 Data-Driven
Goal: Maximize scale & minimize cost |
|||
|
|
|||
| Level 3 Data CENTRIC
Goal: Data-based decisions |
|||
|
|
|||
| Level 2 Data Specialist
Goal: Track KPIs using a BI platform |
|||
|
|
|||
| Level 1 Data Conscious
Goal: Standardized reporting |
|||
|
|

